

In 2018, Kolt joined InVivo Biosystems and works as a Senior Software Developer. Recently, I sat down with Kolt and discussed his role at InVivo, as well as the intersection between information technology and biotechnology. This article will detail Kolt’s work, how he manages his responsibilities, and how computer science is helping to advance the field of life science.

Image 1. Kolt McBride, Senior Software Developer at InVivo Biosystems.
Kolt starts his day at 8:30 am — since Kolt works on a variety of projects, what he works on first thing in the morning depends on the day, and what projects are currently being conducted. The morning work is precursive to a 9:15 am stand up meeting in which his team goes over various projects with clients internally. One of this meeting’s main objectives is for Kolt’s team to coordinate with the lab team to make sure projects are going well in order to have sufficient data analysis once the project is completed. For instance, excessive contamination will make it difficult to capture meaningful data. At this point, the team also needs to make sure there are enough scanners to take images of the worms as the project progresses.
Following the morning meeting, Kolt will go about different tasks depending on what point a project has reached in its timeline. For instance, if the lab team is still conducting tests, then there is time to work on external tasks such as machine learning or network administration. However, once a project is completed, Kolt works intensively on data analysis — a process that takes nearly the entire work day for 2 – 4 weeks.
“Sometimes the compound has clear effects, other times it’s totally benign.”
“Sometimes the compound has clear effects,
other times it’s totally benign.”
“Sometimes the compound has clear effects, other times it’s totally benign.”
Kolt works on projects that utilize InVivo Biosystems’ Longevity platform, which tests the effects of natural compounds on the worm’s lifespan and health. He explains the difficulty in these tests, that “sometimes the compound has clear effects, other times it’s totally benign.” This means that he must look at the data from several different angles to extract meaningful results. Often, there is a trial and error process of data exploitation.
Prior to analyzing datasets, it is important to write proper code to produce figures and run data through as fast as possible. This entails software development of various algorithms to study different data relationships involving neighboring datum or clustered groups. Staying up to date on machine learning literature provides new insight on this process.
Primarily, Kolt uses Python and C + + to write the necessary code. Since it is difficult to write all the code from scratch, there are a variety of resources available to speed up the coding development process. These include SciPy and SKlearn are helpful for Python tools, NumPy helps with linear algebra processing in large datasets, and Matlab can be used in some cases for algorithm manipulation.
Next, Kolt analyzes the data he’s collected. One of the ways he measures the effects of a compound is by posture analysis of nematodes. Healthy worms have an “S” shape; however, as they die, they become straighter and lose movement. Moreover, he tests health and lifespan, which are not always correlated. For example, some drugs trigger genetic pathways related to dietary restrictions causing the worms to stop eating. Oddly enough, this increases their lifespan even though it decreases their health as this is an induced starvation mode. This phenomenon is also seen in modern dieting in which intermittent fasting is said to improve one’s lifespan.
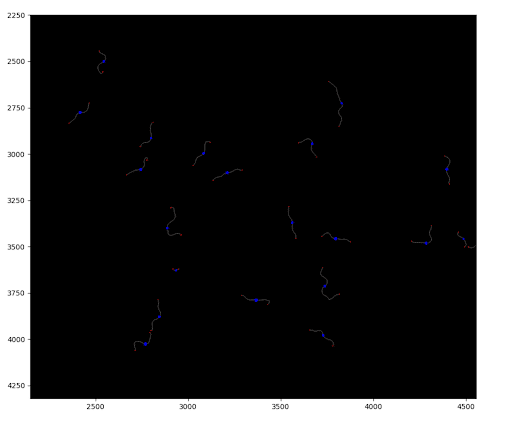
Image 2. Plot of skeletonized worms with their midpoints and ends. The midpoints’ radius is drawn with the width of the worm.
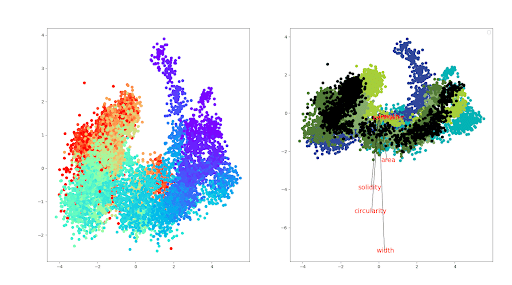
Figure 1. A biplot / principle component analysis of 4 different conditions. The dots are colored over time. The curve is caused because as C. elegans age they shrink, expand, and shrink again. This causes the young worms to look more like dead worms morphologically in some ways
The multi-step process of data collection creates a life cycle for data. This cycle begins with an idea for an experiment, next, the specifics (such as type of worm, treatment, and experiment) are determined. Finally, testing and data collection can begin. At this point it’s imperative to ensure there is space for permanent storage of the data. Once all the data is collected, it needs to be analyzed to understand what it’s saying, and determine whether the results are sufficient. If the analytic process has been done before “there is always continuous improvement [to] go through to make the manual part to a minimum… to give it to the client as fast as possible.” Finally, the data must be backed up on a hard drive and stored for later testing and result comparison.
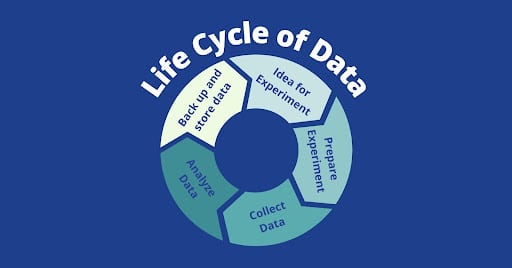
Figure 2. The Lifecycle of data.
“It’s exciting to see whether we get the same or different results.”
“It’s exciting to see whether we get the same
or different results.”
“It’s exciting to see whether we get the same or different results.”
The most important part of Kolt’s job is ensuring proper data is collected from experiments. This means keeping track of the amount of storage available. Data is stored on hard drives, and the accuracy of data interpretation and transfer depends on the code written beforehand. In the instance that there is a lack of space, there are backup drives for data.
Despite heavy technological work, Kolt cites critical thinking skills as a must have for data analysis — being able to determine why a certain result occurred is essential. Furthermore, in order to fully understand what the data is showing it’s necessary to look for data points which you were, and were not, expecting. This process involves producing a hypothesis for the data and a method to test it. For example, if you hypothesize that a certain drug impacts the worms’ curvature, you must devise how to measure the angles along and correct for external variables such as noise in images and the worms’ ages.

Image 3. Plated C. elegans.
Since data plays a huge role in Kolt’s work, it’s no surprise that his favorite part of his job is “the anticipation of experiment [results] … and getting a new dataset.” For example, obtaining data from the longevity platform can take over 35 days until he gets to view the figures which can show trends or evidence of incorrect analysis. For repeated experiments Kolt says that it’s “exciting to see whether we get the same or different results.” Despite his excitement for data, Kolt says that his favorite part of working at InVivo are the people. He cites the diversity of interests and knowledge as one of the perks. He mentions the “people are really into animals, the outdoors, and doing science,” that not only do they “read engaging papers” but they also have “cool pets at work.”