
Home > Technologies > Behavior & Morphology Analysis
More Zebrafish CRO Services
Our C. elegans behavior and morphology analysis platform measures 26 individual characteristics of the morphology and movement patterns of individual animals. This is a deep phenotypic characterization that is well suited to later analysis using sophisticated machine learning techniques.
Our platform offers:
Select & Compare: Choose age-matched C. elegans from at least two distinct groups for a holistic comparison. We analyze and use high-throughput sequencing techniques to compare the two groups and identify differences between them at the genetic and genomic levels. Results are evaluated to gain insight into the impact of environment factors on C. elegans.
Record & Analyze: Capture crawling or swimming behaviors. Analyze the results to determine changes in gene expression and localization. Examine the effects of environmental factors on C. elegans.
Morphology (length, width, area, wavelength) Morphology can also be used to measure the rate of growth and movement. Additionally, it can be used to measure the overall shape of a cell, such as whether it is circular or elongated. Morphological changes can also provide insight into cellular function.
Software-Driven Insights: Benefit from our specialized software that identifies and quantifies intricate behaviors. Our software can also help you identify potential therapeutic targets, understand disease mechanisms, and discover novel therapeutics.
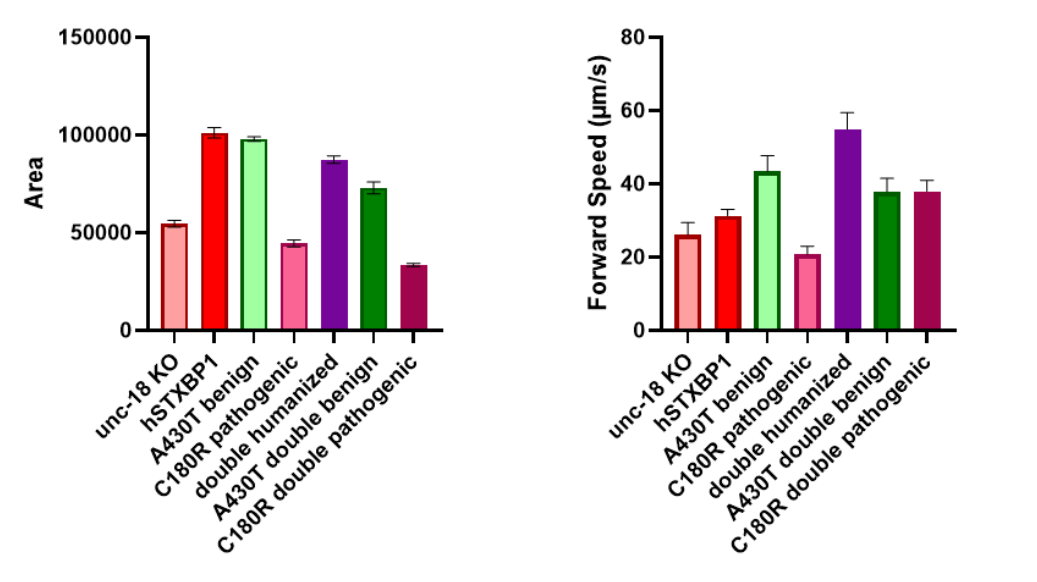
Quantified differences in area and forward speed for 7 different genotypes of C. elegans modeling point mutations in STXBP1, a gene important for epilepsy.
The InVivo Biosystems Newsletter is delivered to your inbox bi-weekly,
giving you all of the latest company updates, industry news, and more.
An expert in CRISPR genome editing, InVivo Biosystems creates custom genome-edited C. elegans and zebrafish models to enable aging, developmental, and disease studies. Our unique in vivo platforms and technologies bridge the gap between cells and mice.