More C. elegans Models Services
C. elegans research projects often involve comparing phenotypes between different strains. In order to be confident that the phenotype researchers observe is due to a known genetic cause, it is vital for them to know the genetic composition of that strain. Understanding the outcrossing meaning is crucial in this context, as outcrossing refers to the process of crossing a particular C. elegans strain with another strain to introduce genetic diversity and eliminate unwanted mutations. This process exemplifies the organism model’s utility in biological models and disease models, positioning C. elegans as a powerful model organism for model systems testing. Without the accurate genetic information, researchers will encounter many problems including:
Understanding the genetic composition is particularly crucial in the context of outcrossing, meaning the introduction of genetic material from outside sources into a breeding line. This practice can lead to unintended genetic changes, affecting the phenotype and potentially confounding research outcomes. Therefore, thorough validation of C. elegans strains is essential for ensuring the reliability of phenotyping results, especially when dealing with outcrossing events.
Based on our own strain validation experience, we have developed a menu of validation services for C. elegans. Phenotyping results are more reliable when you have validated strains, showcasing C. elegans as a well-studied model within a variety of model organisms. Validating strains can be tedious and time-consuming. With our validation services, you’ll save time and money while still getting reliable results and enhancing the control of gene expression in your research.
Learning from our own strain validation experience, we developed a menu of validation services for C. elegans researchers so you have confidence in your phenotyping results from validated strains. Understanding the outcrossing meaning and its importance in C. elegans strains is part of our expertise. This expertise extends to the development of Aβ-expressing nematode models and humanized models, vital for disease models and toxicity assessment. Strain validation can be tedious and time consuming. It is faster and easier for us to perform the services for you than to figure it out on your own, utilizing cutting-edge technologies and powerful technology in cell biology for chronic drug testing and drug discovery candidates.
Service Offerings
For researchers who need more genetic information about their strains, we can provide custom genotyping and sequencing packages and expression validation services that include a full authentication of the genotype of your strain and information about gene expression. All our services fit NIH guidelines for the authentication of key biological reagents, taking advantage of knock-in technology and technology with microfluidics for precision in gene function and gene editing services.
All of these services can also be paired with cryostorage for secure long-term storage of your validated strains.
$850 and up
2-4 weeks
Custom genotyping assay, final report
$1,645 and up
6-8 weeks
Outcross strain(s), custom genotyping assay, final report
$1,075 and up
8-10 weeks
Raw sequencing data, final report
$2,025 and up
2-4 weeks
Final report
$1,975 and up
6-8 weeks
Final report
Who is this service for?
This allows researchers to accurately determine the genetic makeup of their novel strain. Through this process, they can identify any mutations or changes in the strain that could have an effect on its behavior or performance, and it can be used to develop breeding programs to maximize the potential of the novel strain.
This allows researchers to accurately determine the genetic makeup of their novel strain. Through this process, they can identify any mutations or changes in the strain that could have an effect on its behavior or performance, and it can be used to develop breeding programs to maximize the potential of the novel strain.
Service Details
This service allows C. elegans researchers to obtain information regarding the genotype of strains they did not make including:
To genotype the locus of interest, we use a variety of techniques including traditional PCR (Fig. 1), HRMA (Fig. 2), DMAS. Sequencing is included in all techniques (Fig. 3)
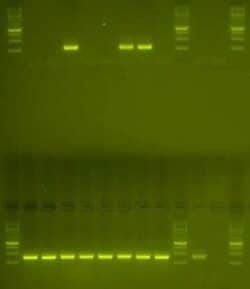
Fig. 1: Determine heterozygous at the locus of interest vs. wild type by detecting the absence or presence of a band. Top row: samples and controls were used in a PCR screen specific to the mutant allele. Three of the samples contain the mutant specific band, but the other samples do not. Bottom row: samples and controls were used in a PCR screen specific to the wild type sequence. All samples and the wild type control amplify at the expected size. We can conclude that three of the samples are heterozygous at the locus of interest and all other samples are wild type.
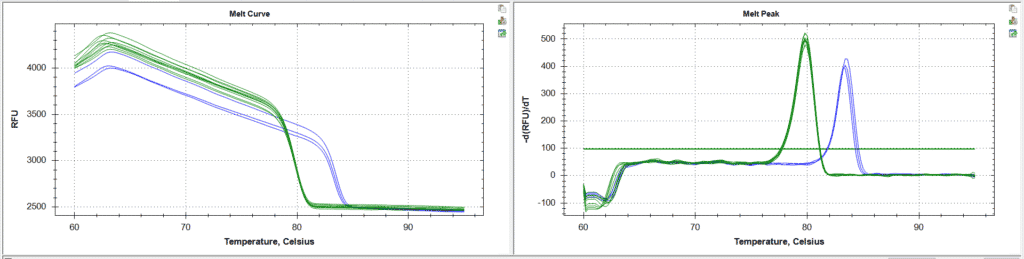
Fig 2: Using HRMA to identify homozygous lines. The sample melt curves are in green and the wildtype controls are in blue. All of the samples have a melt peak at the expected temperature of homozygous mutant. These lines are homozygous.
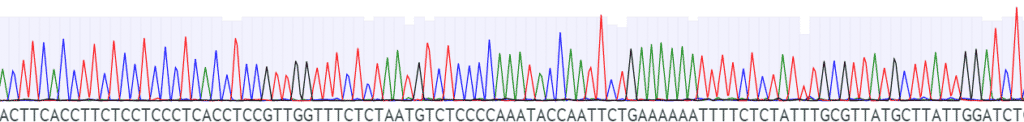
Fig. 3: Confirming the genotype of your strain via sequencing. During the analysis of the sequencing results, we will confirm whether your sequence matches the expected theoretical sequence or not.
Who is this service for?
This package will help you identify whether crosses have occurred between strains. It will also analyze the strain’s genetic diversity. It is important to researchers who want to ensure that a C. elegans strain has a genomic background free from unintended or undesired mutations (Fig. 4) and don’t want to outcross their own strains.
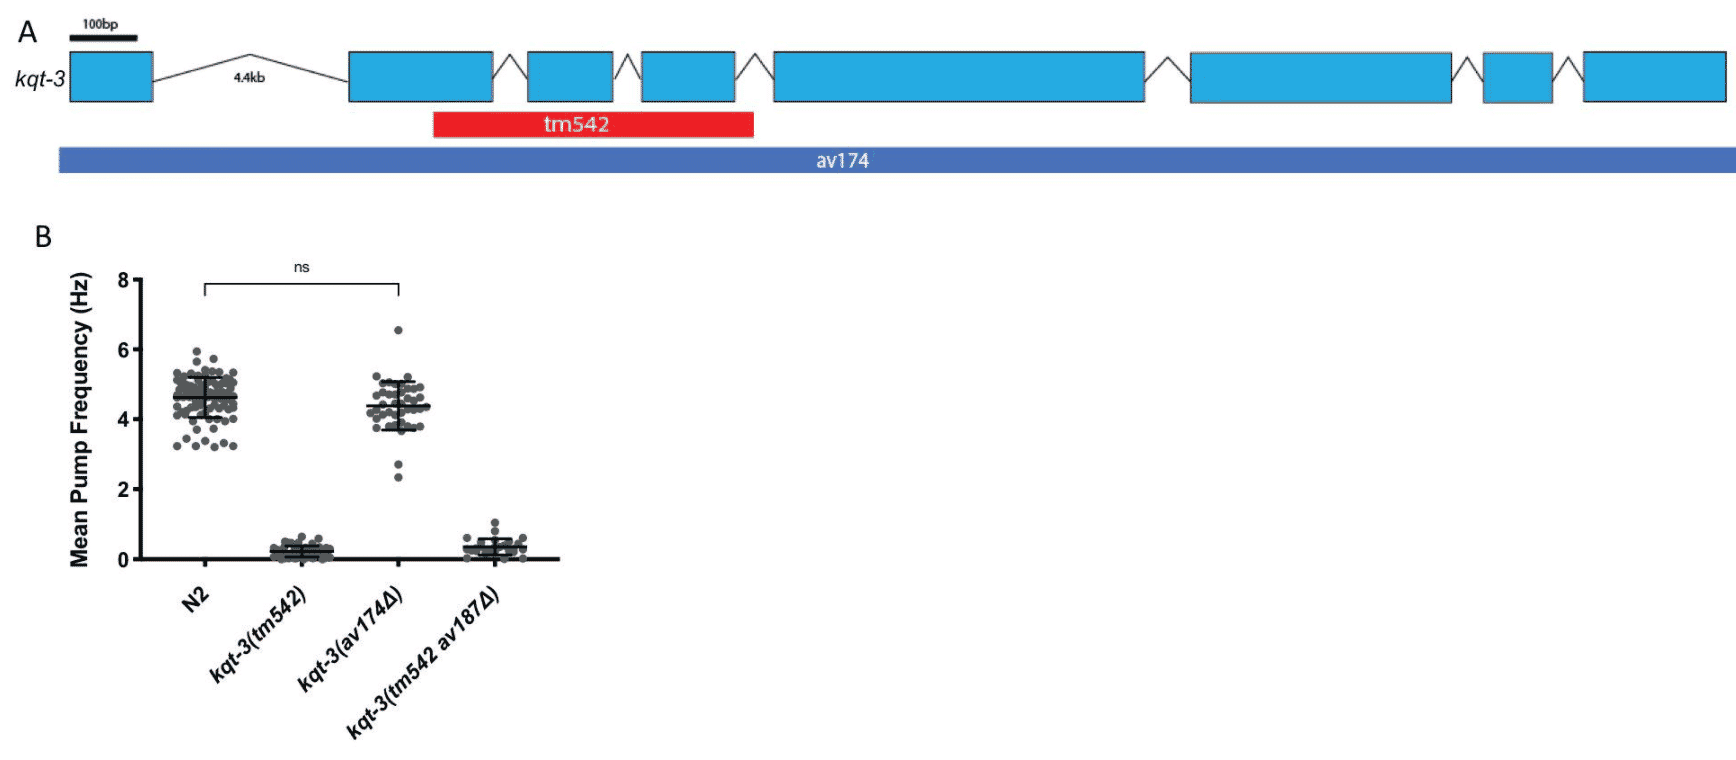

Fig. 4: Background mutations can lead to misinterpretation of phenotypes. Loss of function is a reported phenotype due to a large deletion in the kqt-3 gene. A decrease in the mean pump frequency and additional phenotypes have been observed, such as unregulated defecation cycles (A). However, when the whole coding sequence was knocked out, the researchers did not observe the decrease in mean pump frequency phenotype (B). The decreases in the pumping frequency are caused by something in the background of the kqt-3 strain, not the kqt-3 gene itself. Outcrossing the strain can help identify whether a phenotype is truly attributed to a certain gene.
Service Details
We will do the outcrossing for you so you can obtain the outcrossed strains for your project, while saving your time and hassle. We will deliver:
Who is this service for?
For researchers who need to ensure that their strain has a known background (with no interfering mutations) and determine the genetic cause of a phenotype.
Service Details
With this service, you will get a list of candidate genes and mutations that may be causing the phenotype you have observed and be confident that your strain is free from background mutations.
We provide whole genome sequencing and interpretation of your C. elegans strain including the genomic sequence and data analysis to identify the differences from N2 (or a different reference strain). You will receive data and a report including:
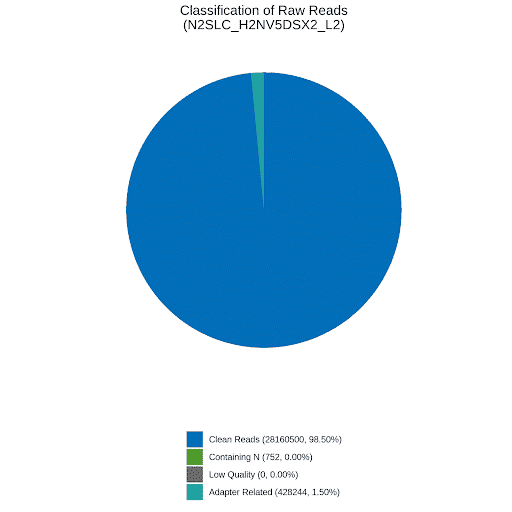
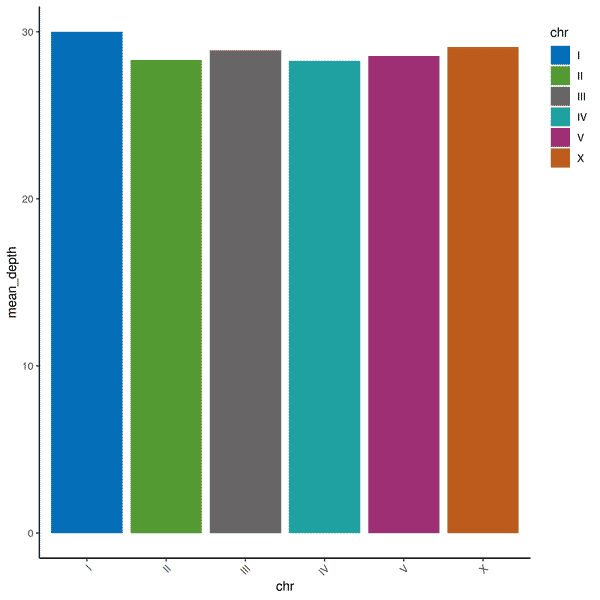
Fig. 5: Example QC and coverage data from Whole genome sequencing (WGS). (Left): the pie chart shows that 28,160,500 clean reads were obtained (98.5%) from 4.2GB of sequencing data. (Right): the bar graph shows that coverage was equally spread between the six C. elegans chromosomes. Coverage of at least 1x was obtained for 99.96% of the genome. Coverage of at least 4x was obtained for at least 99.91% of the genome. The average depth of coverage was 28.94x.
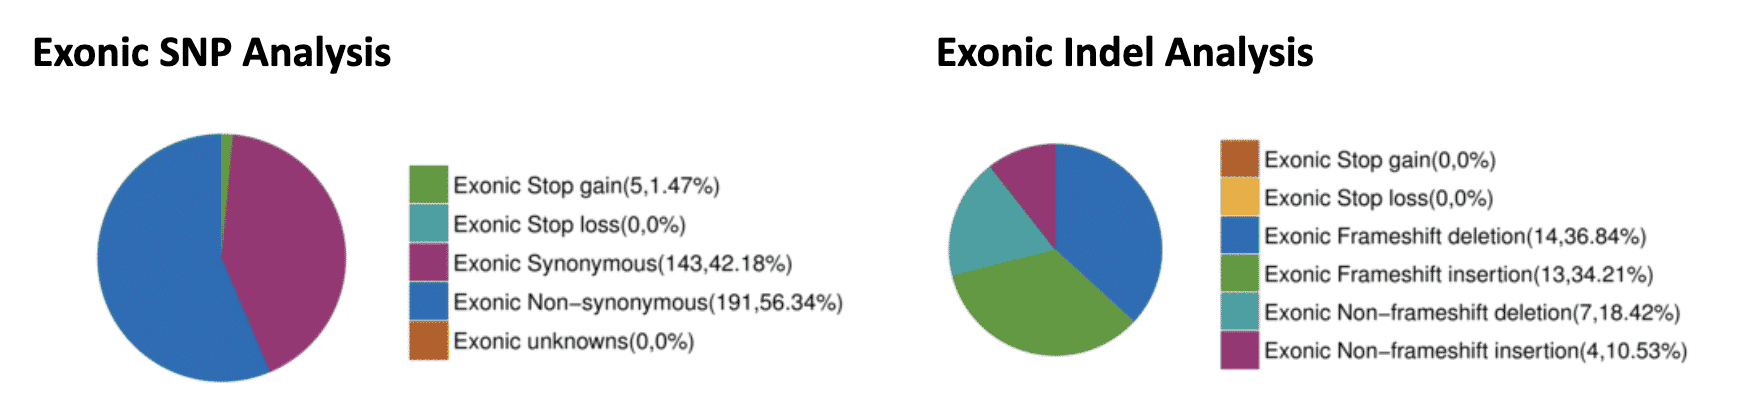
Table 1: SNPs leading to early stop.
Fig. 6: Exonic SNP and Indel Analysis. SNPs and Indels were detected and filtered for those occurring within exons. Within the coding regions, 143 synonymous SNPs were identified that should not have an effect on the protein coding sequence. However, 191 non-synonymous SNPs and 5 early stop SNPs were also identified that may affect protein function. Also, 27 frameshift causing insertions and deletions were identified.
Who is this service for?
For researchers who need to make sure that the coding sequence is being expressed as intended and gain a better understanding of the expression products from their gene of interest.
Service Details
Sequence analysis of the expressed mRNA.
We provide a report showing the sequencing results including:
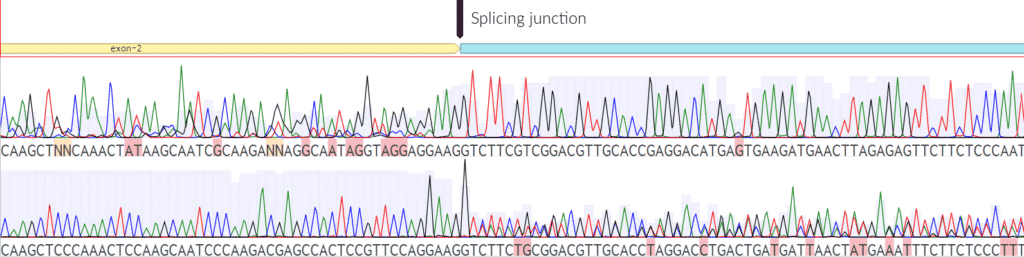
Fig. 7: Incorrectly spliced junction. Above is an example of a junction that is not splicing correctly. Notice that the sequencing is correct and clean from both directions until it reaches the splicing junction. We would recommend fixing this sequence based on the splicing data above.
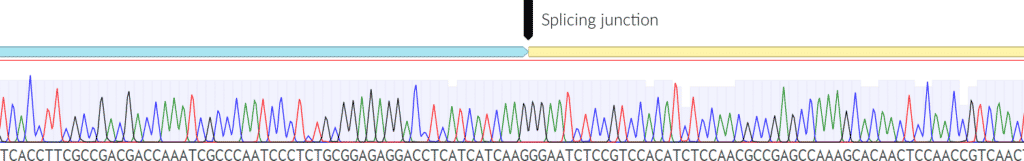
Fig. 8: Correctly spliced junction. Above is an example of a junction that is splicing correctly. The sequencing remains correct and of good quality throughout the read.
Did you know?
Often synthetic introns are introduced into a transgene sequence to help with expression. It is important to be sure that those introns are splicing out correctly and that no aberrant splicing sites have been introduced. If the splicing does not occur correctly, then the protein sequence may be incorrect or may not even express at all.
Additionally, when researchers are beginning to explore a new gene, they may not know the most abundant isoform or even the true start and stop of the coding sequence. Without this information, they may incorrectly tag the “start” of the gene only to find out that the true start ATG was in exon 2. This information is needed for many genome editing activities and other molecular assays.
Who is this service for?
This service is useful for researchers who need to be able to accurately interpret the data they collect, as changes in gene expression can have an effect on the phenotype of the strain. By verifying the expression levels are not altered, researchers can ensure that the data they collect is accurate and reliable.
Service Details
This service allows C. elegans researchers to gain insight into their strain of interest by knowing whether their gene of interest is being expressed adequately. By checking the expression levels via qPCR, we can provide data regarding the expression level of your gene of interest in the strain you are working with (Fig. 9).
A final report including results, data analysis, and materials & methods will be delivered to you.
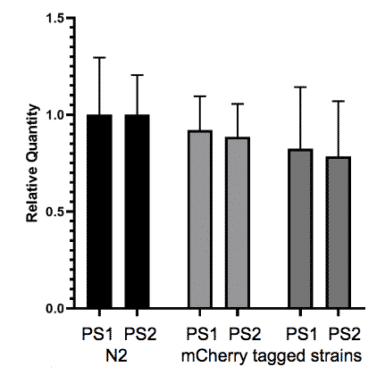
Fig. 9: Expression analysis shows endogenous fluorescent tagging has no effect on expression of the tagged gene. Expression of a tagged gene. The gene of interest was tagged at the N-terminus with mCherry fluorescent protein using CRISPR/Cas9. Two primer sets (PS1 and PS2) were designed to the gene of interest. Neither of the mCherry tagged strains (grey bars) showed a significant difference from N2 wild-type (black bars) in gene expression.
Ready to get started?
Ready to connect with us to learn more about working with our company or our technology?
Submit your inquiry below & we will get back to you soon.
The InVivo Biosystems Newsletter is delivered to your inbox bi-weekly,
giving you all of the latest company updates, industry news, and more.
An expert in CRISPR genome editing, InVivo Biosystems creates custom genome-edited C. elegans and zebrafish models to enable aging, developmental, and disease studies. Our unique in vivo platforms and technologies bridge the gap between cells and mice.