
Do you ever get a hunch that gets reinforced so often your mind starts believing it as fact?
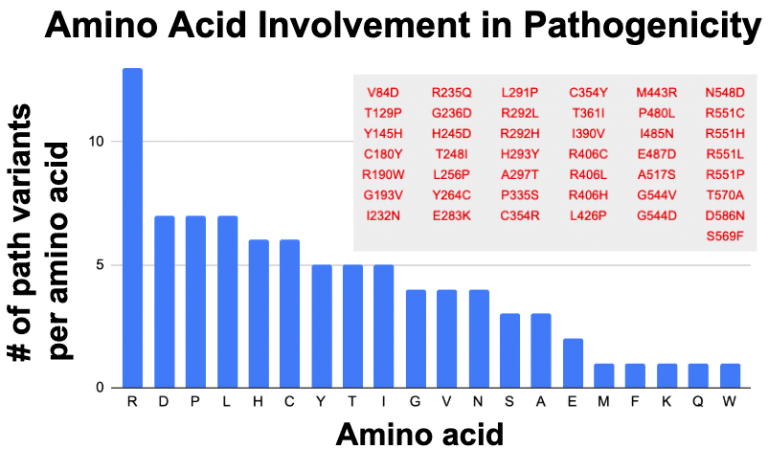
My hunch was that the amino acid arginine (Aka: “Arg” or “R) seems to be showing frequent association with pathogenicity. It started with the observation that many of the established pathogenic variants in the coding sequence of STXBP1 seem to involve a preference for arginine. Extracting from ClinVar for missense that are pathogenic and likely pathogenic gives the following table:

Indeed arginine (R) is disproportionately represented. Assuming all amino acids are equals, then there should be 4.3 for each amino acid. Disproportionally low are things that make sense, such as methionine (M), which only has one codon (ATG) instructing for insertion of this amino acid in a sequence. Similarly tryptophan (W) also has only one codon (TGG). These two amino acids should be represented below the average. A little bit oddly, we have similar low levels from lysine (K), phenylalanine (F) and glutamate (Q), which each have two codons. If codon dosage was key to variant proportioning, then these should have been seen at least 2x more than M and W, so perhaps something more than codon dosage mediates amino acid choice in creating pathogenic variations.
Arginine has 6 codons which still could drive its outsized proportion in the graph. Yet Serine (S) and Leucine (L) also have 6 codons. But respectively they are at 7 and 3 for being involved in pathogenicity. Only mighty arginine accounts for 13 of the 43 pathogenic variants in STXBP1 (30%). Tempering my enthusiasm is the observation that for 3 amino acid positions R292, R406 and R451, we have multiple changes being called pathogenic. Yet no other amino acid in the STXBP1 pathogenics has this changling capacity, so why is it that arginine is at high proportion in the assigned pathogenics? Perhaps it is just a consequence of a biased investigator focus specific to STXBP1 and they fixed their gaze onto the repeating de novo clinical variants at positions 292, 406 and 451.
Is arginine involved in fragility elsewhere in the genome?
To normalize for possible investigator bias and find a method that can be applied to other portions of the genome, I took advantage of the Ensembl database to list and rank a gene’s codon sequence variants by bioinformatics analysis. Ranking on CADD was used to list protein coding sequence variations by their severity.
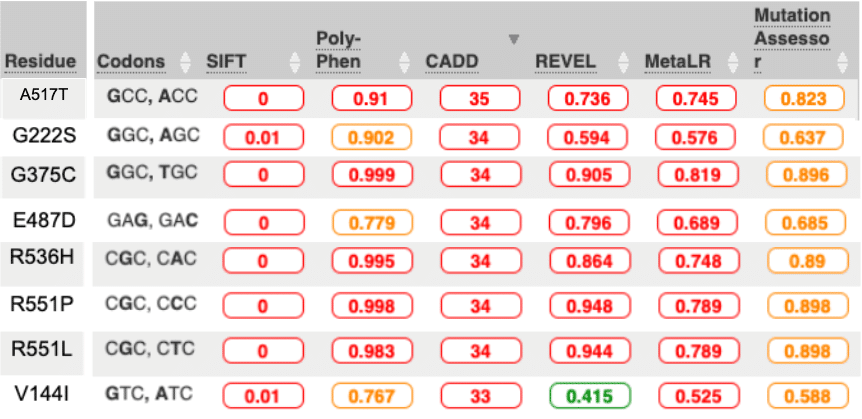
Ensembl allows us to identify which variations are theoretically likely to be disruptive of protein function. The choice to rank by CADD (stand for Combined Annotation-Dependent Depletion) allows us to use a sophisticated algorithm that avoids investigator bias because it intentionally avoids using “known” pathogenicity databases when it creates it ranking. A key test is to see if CADD can independently observe the pathogenicity known to exist in STXBP1. To construct the test, we compare the top scoring CADD variants with the lowest scoring CADD variants.
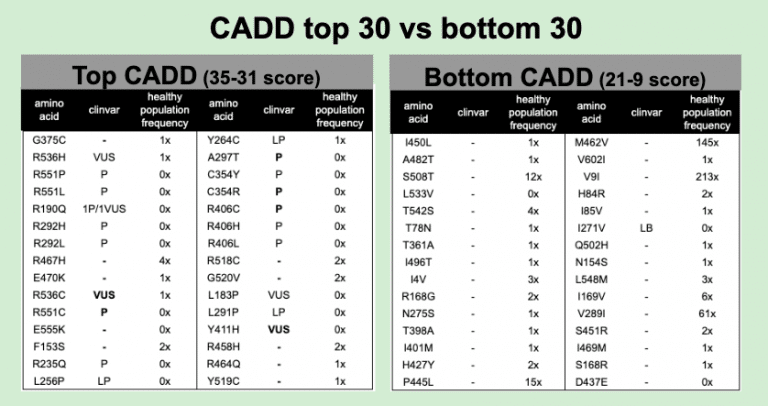
With CADD, we get an independent call for possible pathogenicity that still picks up what you might expect. Nearly half the calls in the Top-30 CADD pull up known pathogenicity and no benign calls are found. In the Bottom-30 CADD we get one known benign call and no pathogenics.
Healthy population data also is consistent. STXBP1 is autosomal dominant. That means you only need one of your two chromosomal copies to be defective and disease will occur. Selection pressure has been very tight on autosomal dominant genes. Variants in healthy population cannot occur at higher than the known frequency of the disease in the population. Published frequency in STXBP1 for causing early-infantile epileptic encephalopathy is 1/90,000. The largest healthy population database is in GnomAD. At 141,456 individuals, and the fact that STXBP1 needs to distribute across at least 43 pathogenic alleles, the likeliness of even one pathogenic variant being in healthy populations is pretty close to zero. Some of our Top-30 CADD have 1x or more frequency in healthy populations. Most of these are unassigned. For these unassigned that are seen at 1x or more, the disease frequency argument strongly implicates that they are benign variants.
So the CADD is not perfect, the top scoring hits are a mix of known pathogenic and probably benign. But the bottom scoring CADD seems to be more efficient at pulling out benign. In the Bottom-30 CADD, only one variant, I271V, is labeled Likely Benign by ClinVar, yet nearly everyone of these alleles (27 of 30) is seen in healthy populations, so they too are probably benign.
At this point in the analysis, we can pinpoint an anomaly. Y264C is labeled in ClinVar as a Likely Pathogenic. But from the population frequency argument, this assignment is highly unlikely. Y264C has been observed to occur in healthy populations. So a a bare minimum, it should be downgraded to a VUS, but probably be called a Likely Benign for causing early-infantile epileptic encephalopathy.
Finding Arginine-associated Fragility Throughout the Genome
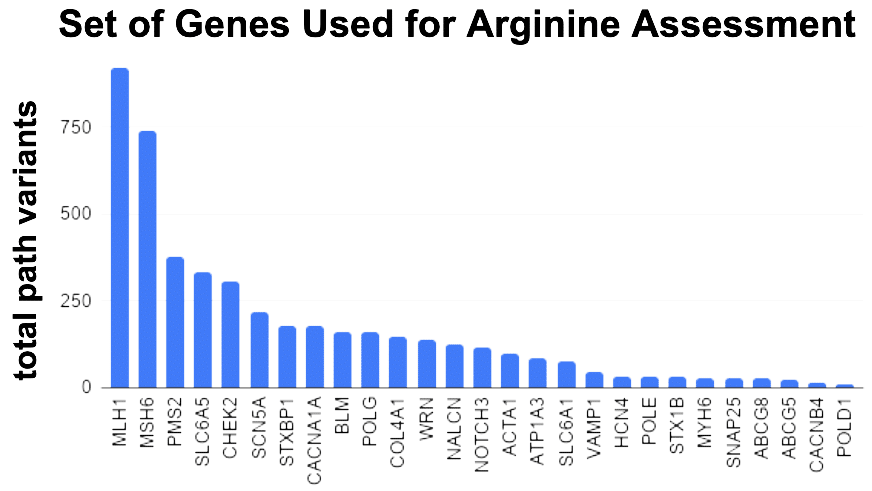
This top-30 / bottom-30 approach was applied to a large set of genes. As a form of internal control, we add isoleucine (I) in the screen. With less conviction, I have felt this amino acid was associating with benign variants. If true, it should show an enrichment in the Bottom 30 CADD scores. So in my gene set experiment, I measured 4 bins. 2 bins for how many arginine and isoleucine in the Top 30 and 2 bins for how many arginine and isoleucine in the Bottom 30.
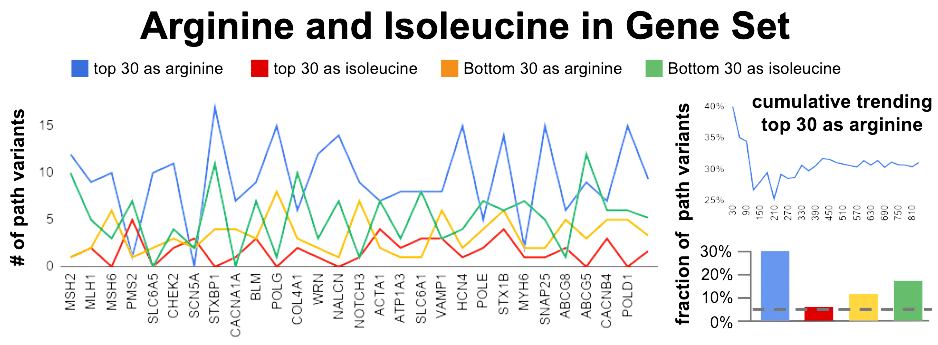
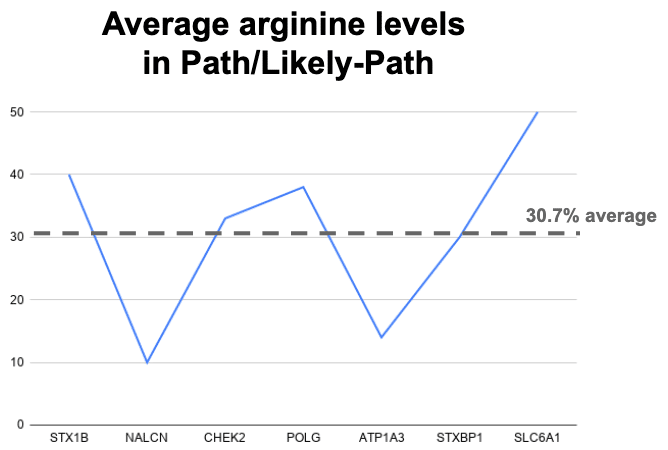
30% of top 30 CADD scoring variants contain arginine?
An assumption of even distribution of amino acids, combined with an even more absurd assumption of an average 3.05 codons per amino acid, gives us 4.3% as average amino acid fraction per each 30 (dashed line). Arginine is 7.2x more than this average number. Yet, we need to account for the fact arginine uses about 2x more than the average codon usage. A a result Arginine bias in the Top 30 is about 3.5x more than expected. For isoleucine, the enrichment in the bottom 30 appears to be about 2x more than expected.
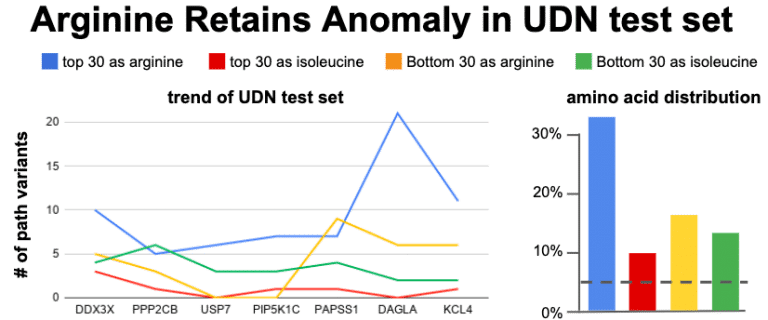
Test dataset – 30% arginine in Top-30 CADD prevails
The noisiest data in the Top-30 CADD appears to be the Arginine data. A cumulative trending plot was used to see how many genes were need before the trend to 30% becomes apparent. After assessing 7 genes the trend starts to stabilize. A new set of 7 genes were chosen. This time the genes were chosen from the Undiagnosed Disease Network (UDN). The UDN recently listed 54 genes as in desperate need for animal modeling to provide gene function studies. A sub-selection of these were identified as having good sequence similarity to genes in the animal models which we hold dear to our heart and expertise (zebrafish and C. elegans). The Top-30 / Bottom-30 CADD selection was applied to these genes and plotted for Arg and Leu enrichment. 30% prevails for arginine – it occurs at least 3.5x more than expected for being the top CADD variants as hypersensitive to substitution.
This all assumes that the representation of amino acids is uniform across all proteins. But the that is a reach. Louis Gross at University of Tennessee, Knoxville, has observed the amino acid distribution in vertebrates has some anomalies.
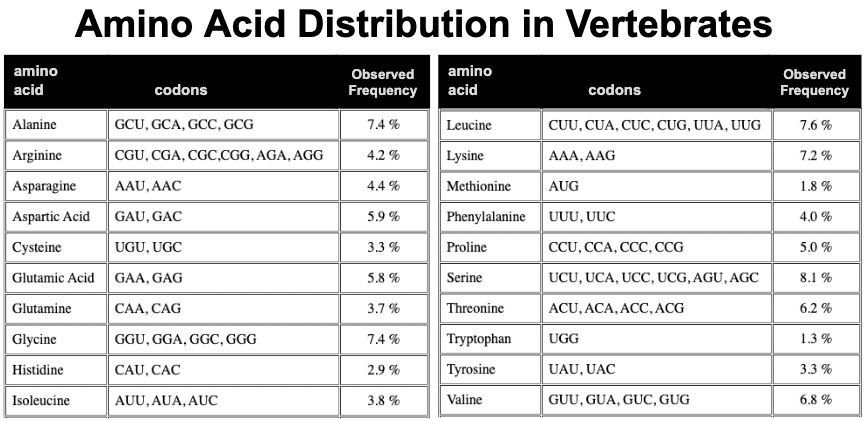
Most notable anomaly is arginine. 6 codons are use by arginine, but the observed frequency is low at 4.2%. To illustrate how low, they calculated the expected frequency for each amino acid biasing only for the GC richness of vertebrate genomes.
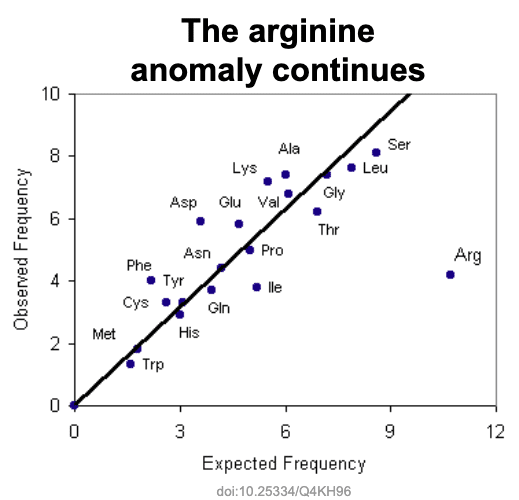
The expected frequency for arginine is quite high at about 10.5% due to its GC richness in its codons. Yet the actual observed frequency is quite low at about 4%. Based on this observed frequency, we bounce back – we now assess that we are observing arginine in the top 30 at 8x more than expected. No explanation for the anomaly and it just became more pronounced!
Taking a different approach, we can ask what percentage of ALL known pathogenic and likely pathogenic variants in a gene involve arginine substitution. 7 genes analyzed and we get the same 30% for arginine. Yet the calculations are that it should be below 4%. 8x more than expected prevails.
Are your arginines special too?
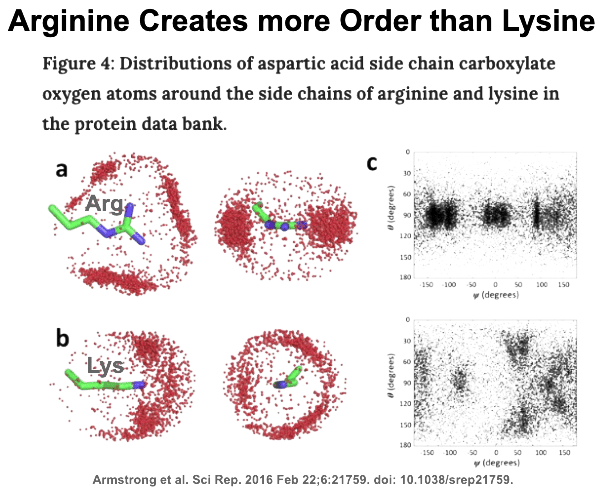
This analysis has uncovered a unique phenomenon. It appear everyone’s arginines are special. Exactly why arginine has this special status is not entirely clear. It is highly likely that arginine has been strongly selected against its random incorporation during evolution. As a result of this strong negative selection (much more than what is happening for all other amino acids), arginine’s frequency in all proteins is much lower than predicted. The observed pathogenic sensitivity may be a read out of this hyperselectivity of evolution. Basically, arginine’s use in any given protein is very particular. A possible driver for this is arginine’s amazing capacity to bring high order to neighboring side chains in most protein structures. When it is gone, chaos reigns. When it is introduced where it should not be, chaos still reigns.
Arginine is special. I suggest we need to ditch Douglas Adam’s “42”.
Instead, we make like a pirate and just say: “Arrrrrrrrg”